Query Viewer
Learn about the various components of the Pull Reports™ Query Viewer client.
The Query Viewer displays controls to interact with one <canned_query> to create
an export result. The Query Viewer is only applicable to <report> configurations
which contain at least one <canned_query>.
The Query Viewer has the following components:
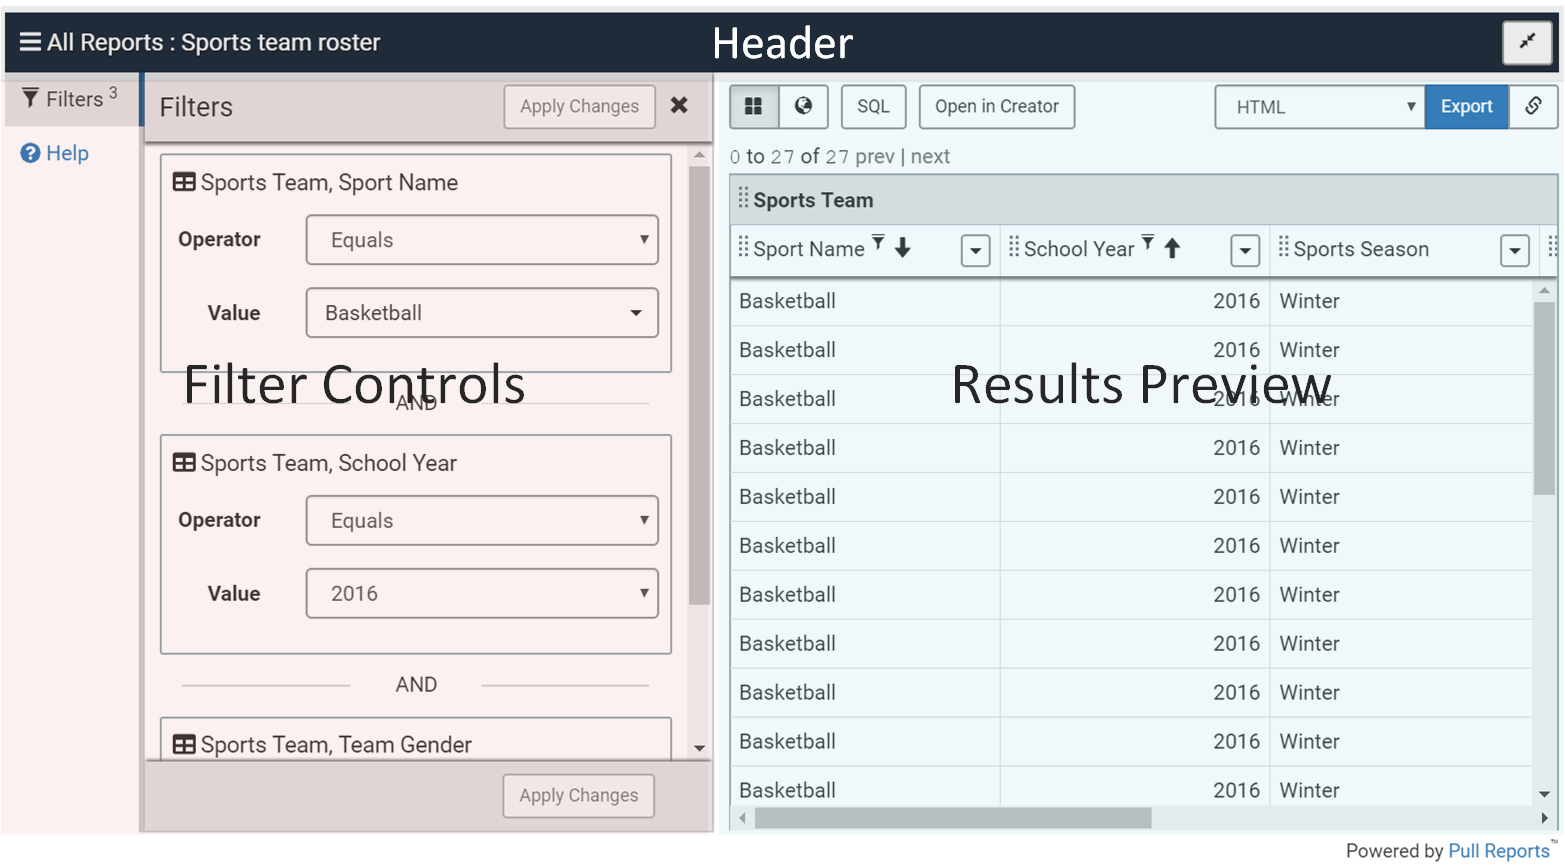
Header
The header displays the current <canned_query> name and the full screen button.
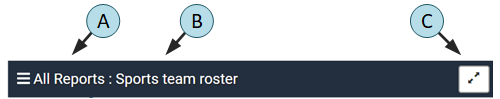
- A. "All Reports" breadcrumb
-
The "All Reports" breadcrumb links to the
Report Repository. - B. Report name
-
The
<canned_query>'snameattribute. - C. Full Screen
-
Toggles the creator between normal and full screen mode.
Press the Full Screen button again or the Escape key to exit full screen mode.
Filters Panel
The Filters panel supports editing of
filter
parameters to be applied to the Export Report REST API export.
The filter configuration is preset by the <canned_query> configuration,
but the filter operator and value(s) may be adjusted to customize the export result.
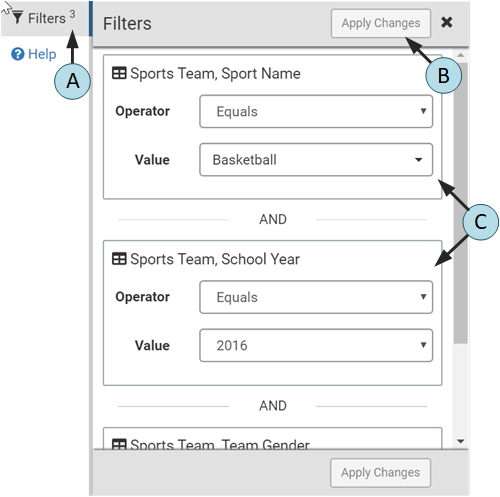
- A. Filter panel indicator
-
The Filters panel indicator reflects the number of filters applied to the Export Report REST API export as a superscript to the
Filterslabel. - B. Apply Changes button
-
The Apply Changes button becomes active when a user changes a filter's operator or value. Click the button to apply the filter changes to the export result.
- C. Filter(s)
-
Each filter configured by the
<canned_query>is listed with appropriate operator and value controls.
Result Preview
The Results Preview displays a limited preview of the export results
and contains controls to export the
report to any export format.
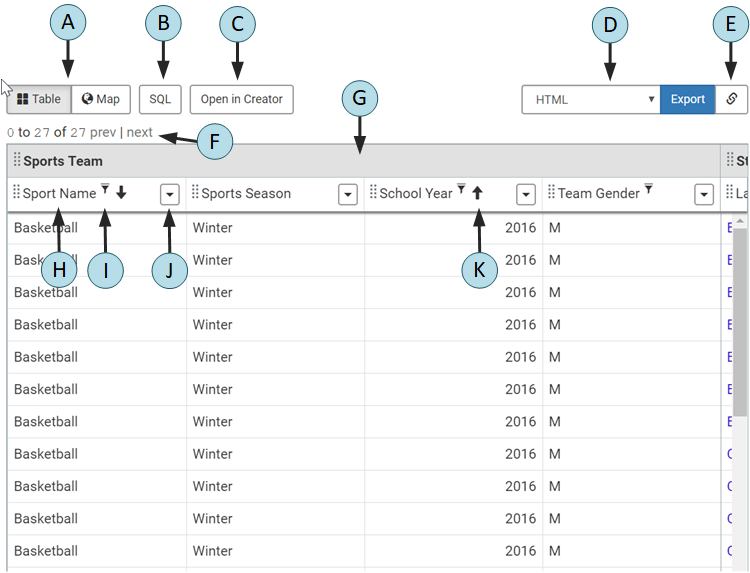
- A. View mode buttons
-
Toggles the Results Preview between table and map view. The View mode buttons are only available if the
<report>may be exported to thegeojsonformat.The default view mode may be set via the
viewMode<canned_query>attribute. - B. SQL dialog button
-
Displays the Structured Query Language (SQL) and query parameters to be used when creating the export result.
The
SQLbutton is visible when the export.sql.active configuration property istruefor the report and the current user is permitted to request the GET Export SQL endpoint. - C. Open in Creator button
-
Clicking the Open in Creator button opens the current export report configuration in the Ad Hoc Report Creator to further parameterize the export report. Use the browser's back button to return to the Query Viewer.
- D. Export format select and button
-
The export format select list displays the available export
formatparameter values. TheExportbutton exports the full report to a new browser window in the chosen format.The
Exportbutton turns red and becomes disabled if the total number of results exceeds the configuredexport.report.maxResults. - E. Export URL dialog button
-
The export URL dialog button reveals the Export Report REST API URL and HTTP parameters to be used when the
Exportbutton is clicked. - F. Pagination indicator and links
-
The pagination indicator and controls display the current page of export results with links to navigate to the previous and next page. The page size is 100 records.
The total number of results displays red if it exceeds the configured
export.report.maxResults. - G. Table cell header
-
Table cell headers are above adjacent columns within the same table. Re-position all columns under the header by dragging the table cell header to the left or right. Click the remove button to remove all columns under the header from the export results.
A table description indicator appears in the lower left corner of the header if the associated
<table>element has a<description>. Click the indicator to display the description. - H. Column cell header
-
Column cell headers are above each column. Re-position a column by dragging the column cell header to the left or right.
A column description indicator appears in the lower left corner of the header if the associated
<column>element has a<description>. Click the indicator to display the description.Adjust column width by dragging the column border to the left or right. The Report Creator saves the adjusted width in the browser's local storage so that the custom width persists between preview refreshes.
- I. Filter indicator
-
Column cell headers display a filter icon if the column is used within a filter.
- J. Column cell header controls
-
Click the Column cell header remove button to remove the column from the export results. Click the Column cell header menu button to display additional controls for column sorting, filtering, and positioning.
- K. Sort indicator
-
Column cell headers display an ascending or descending indicator if the respective sort is applied to the column.